Project case study
SmartBreeds: calibrated dog-breed vision with visible failure modes.
SmartBreeds evaluates fine-grained dog-breed recognition as an uncertainty problem. The current result uses a 100-breed Tsinghua Dogs subset, frozen DINOv2-small embeddings, temperature scaling, and RAPS conformal prediction sets. The claim is narrow: aggregate calibration is strong, but class-conditional coverage still fails for specific breeds.
96-second narrated preview. It frames the project as calibrated fine-grained vision, not as a production classifier claim.
Current Tsinghua100 result
Top-1
0.846
DINOv2-small nearest-prototype classifier
ECE
0.051
after temperature scaling on the held-out test split
Global RAPS
0.968
coverage at mean prediction set size 2.59
Mondrian RAPS
0.9165
label-conditional coverage
Worst class
0.60
bluetick under label-conditional RAPS
Method
RAPS is selected without touching the test split.
- Extract DINOv2-small embeddings for each dog image.
- Fit nearest-prototype breed scores on the training split.
- Choose temperature on calibration negative log likelihood.
- Choose RAPS parameters on a tuning split.
- Set the conformal threshold on proper calibration.
- Evaluate the test split once.
- Method
- Global RAPS
- Coverage
- 0.968
- Mean set size
- 2.5885
- Worst class
- great_dane, 0.80
- Method
- Mondrian RAPS, label-conditional
- Coverage
- 0.9165
- Mean set size
- 3.2055
- Worst class
- bluetick, 0.60
- Method
- Family-pooled RAPS
- Coverage
- 0.9250
- Mean set size
- 2.0835
- Worst class
- english_setter, 0.60
| Method | Coverage | Mean set size | Worst class |
|---|---|---|---|
| Global RAPS | 0.968 | 2.5885 | great_dane, 0.80 |
| Mondrian RAPS, label-conditional | 0.9165 | 3.2055 | bluetick, 0.60 |
| Family-pooled RAPS | 0.9250 | 2.0835 | english_setter, 0.60 |
Calibration
The confidence scores are close enough to inspect.
ECE alone is too compressed for review. The reliability figure and the summary table make the calibration claim readable on desktop and phone screens.
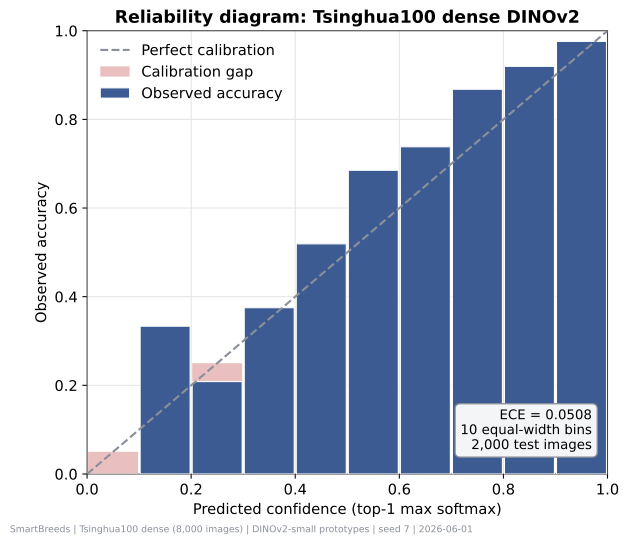
Test predictions
2,000
Temperature
0.0458
Mean confidence
0.796
Top-1 accuracy
0.846
ECE
0.0508
| Quantity | Value |
|---|---|
| Test predictions | 2,000 |
| Temperature | 0.0458 |
| Mean confidence | 0.796 |
| Top-1 accuracy | 0.846 |
| ECE | 0.0508 |
Limitation
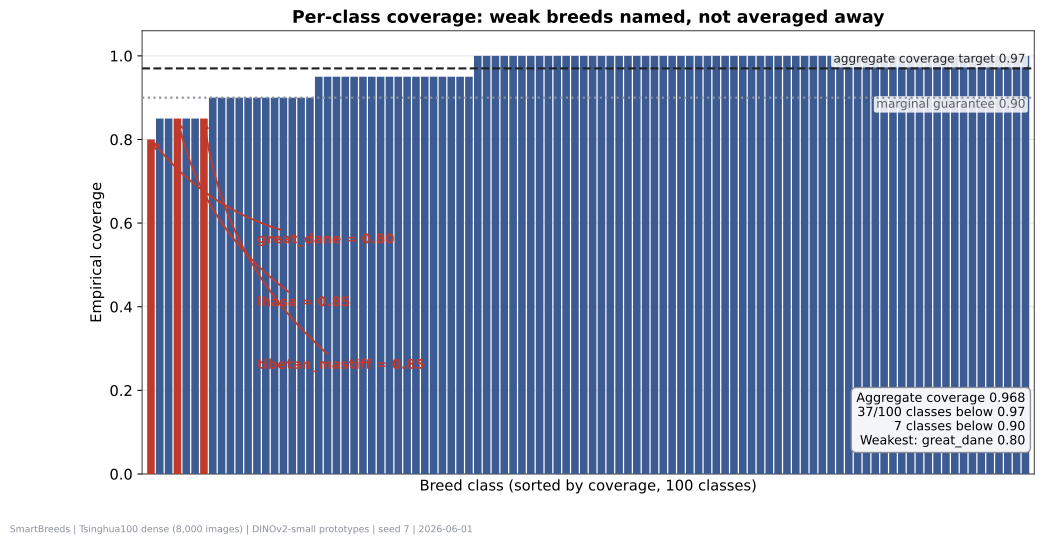
Aggregate coverage is not uniform coverage.
Global RAPS exceeds the 0.90 target on average. That does not mean every breed is covered. The weak-class table is the real research question: where does the calibrated set stop protecting the tail?
Global RAPS
0.968
mean set size 2.59
Mondrian RAPS
0.9165
label-conditional coverage
Worst observed class
0.60
bluetick under Mondrian RAPS
- Breed
- lhasa
- Global RAPS
- 0.85
- Mondrian RAPS
- 0.85
- Family-pooled RAPS
- 0.75
- Top-1
- 0.75
- Breed
- tibetan_mastiff
- Global RAPS
- 0.85
- Mondrian RAPS
- 0.90
- Family-pooled RAPS
- 0.85
- Top-1
- 0.70
- Breed
- great_dane
- Global RAPS
- 0.80
- Mondrian RAPS
- 0.70
- Family-pooled RAPS
- 0.75
- Top-1
- 0.55
| Breed | Global RAPS | Mondrian RAPS | Family-pooled RAPS | Top-1 |
|---|---|---|---|---|
| lhasa | 0.85 | 0.85 | 0.75 | 0.75 |
| tibetan_mastiff | 0.85 | 0.90 | 0.85 | 0.70 |
| great_dane | 0.80 | 0.70 | 0.75 | 0.55 |
Next paper slice
The WACV-ready question is per-class reliability.
The strongest current claim is not that SmartBreeds is a better dog app. The claim is methodological: RAPS selection can produce small calibrated prediction sets on a fine-grained vision slice, while per-class analysis exposes where the guarantee is only marginal.
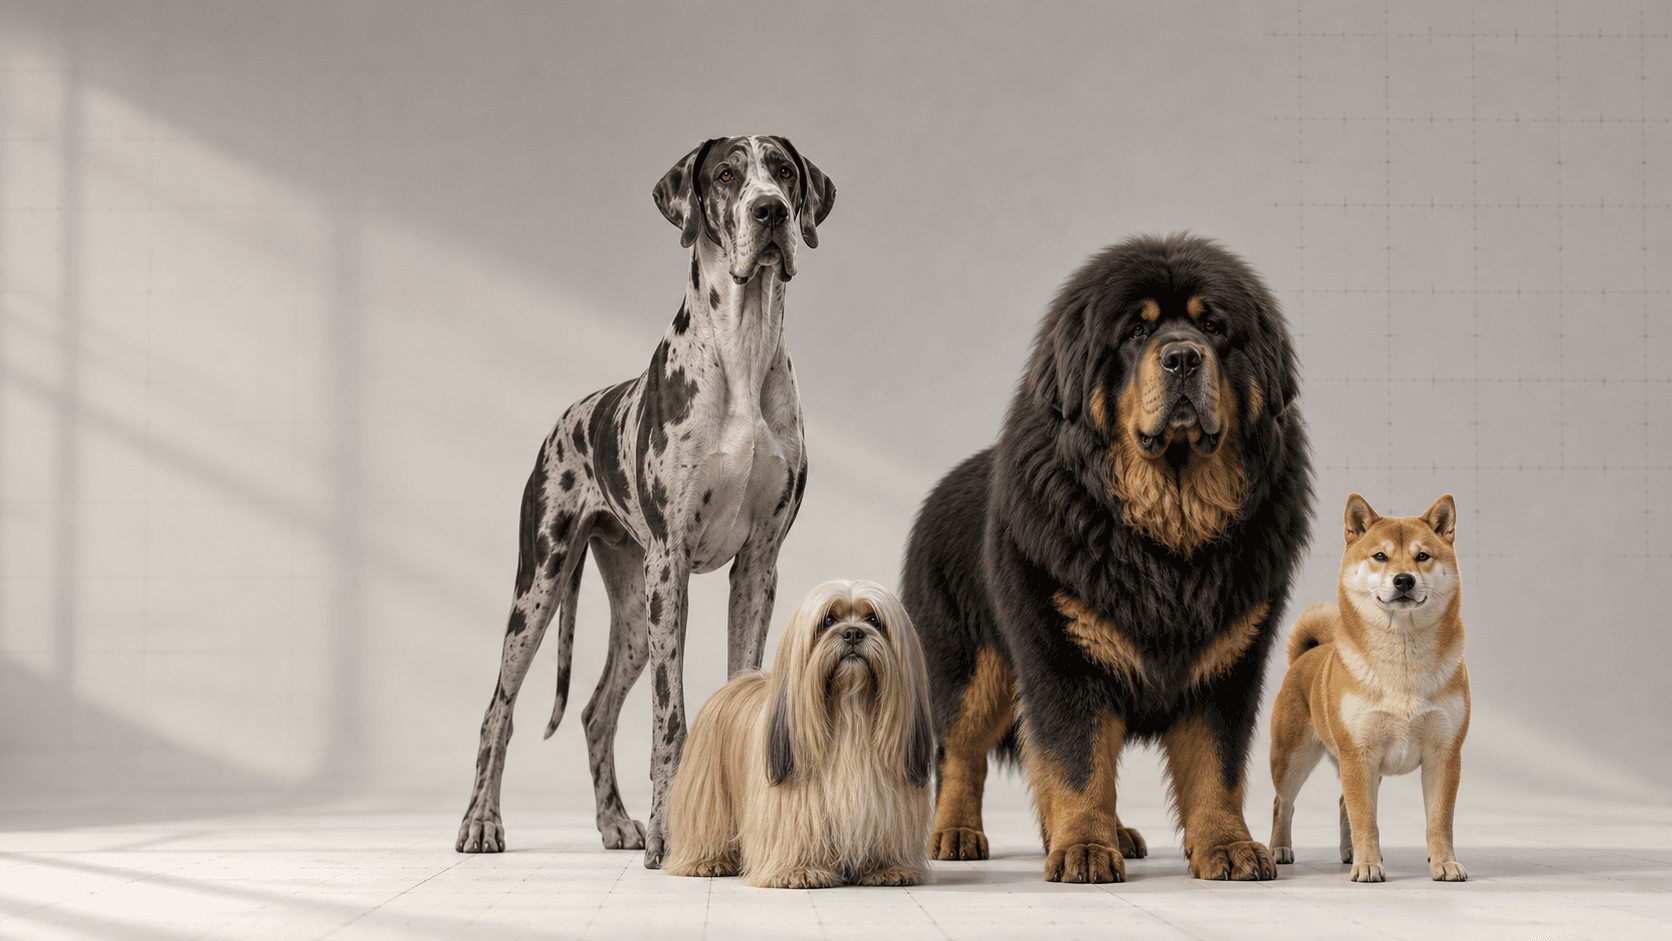
The next experiments should add failure contact sheets with private dataset images, class-specific slack penalties, and higher-density sampling for the weakest breeds. Public pages should keep using synthetic dog visuals until dataset license review is complete.
Research notes live in the private SmartBreeds repo. The public writing should cite the Tsinghua Dogs subset and avoid claiming a full benchmark until the full dataset protocol is locked.
Repo evidence: SmartBreeds metrics are stored as JSON and Markdown artifacts. The video and figures on this page are public-safe renderings with no dataset-derived dog photos.